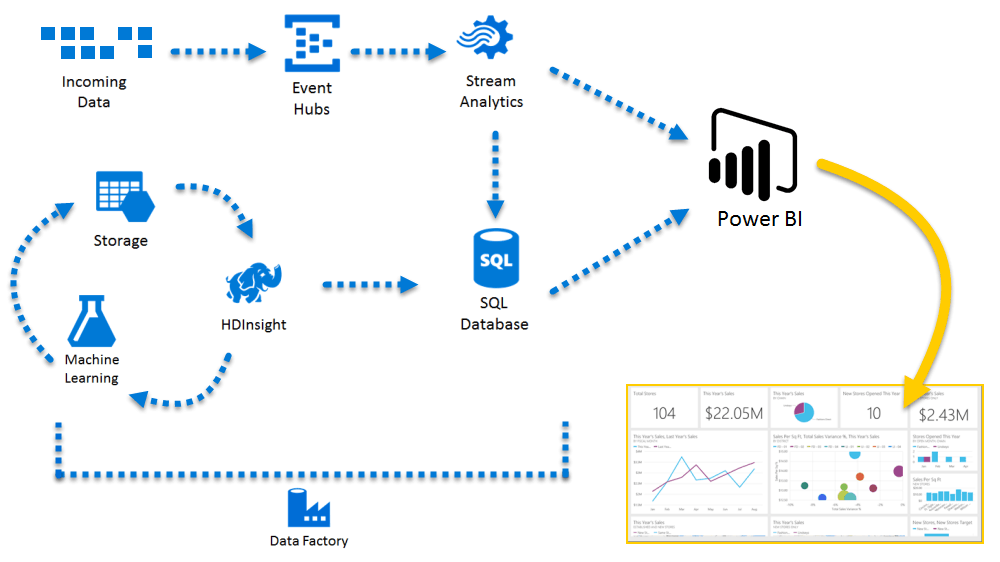
Azure Consumption and Insight Connector in Power BI Desktop offers various benefits to developers and lets the enterprise customers pull Azure Charge and usage data for Azure as well as Marketplace resources. Complicated tasks like analyzing and exploring have become easy while the users can also make their own custom dashboard to make their workspace more effective. Power BI Content Pack gives a detailed analysis of the data and informs the user about the user about Azure usage and spending details.
What are New Features Added in BI Connector?
There are four major changes you can witness in the new version of BI Connector. There are four data sets for the default behavior and current billing period is available for the usage and price. The data is available for Balance Summary and Marketplace. New parameters are added in the moving window of the data and you can save a historical moment like the top sales and comparisons between the two most sold occasions.
How to Start?
To start Power BI Connector, you can get complete guidance from Azure Consumption and Insights Connector documentation to check the new dashboard to move the existing dashboards Azure enterprise Connector to the new version. For the further information, the users can check updates on Azure Feedback Forum.


Leave A Comment