
Azure Monitor for virtual machines is designed to collect network connection data to be able to analyze VM network traffic. It provides analytics on the number of connections, both live and failed, VM connection dependencies and the number of bytes sent and received. Azure Monitor allows detecting malicious connections down to the process level and reports these IP addresses and threat level. VMBoundPort data set report provides data analysis of all open ports and associated connections for security analysis.
Workbooks prebuilt reporting
Azure Monitor for VMs ships with Workbooks that provide prebuilt, editable reporting tools. To get started with Workbooks navigate to Azure Monitor and select Virtual Machines (preview) from the menu. Next, navigate to Performance or Map tab and select View Workbook that opens the Workbook gallery. The gallery provides the following Workbooks:
- Connections overview
- Failed connections
- TCP traffic
- Traffic comparison
- Active ports
- Open ports
Workbooks allow analysis of the connection data for a single VM as well as for groups of VMs and VM scale sets.
Data analysis with Log Analytics
It is also possible to use Log Analytics to analyse the data. Navigate to Azure Monitor and select Logs to get started with Log Analytics. The logs view displays the selected workspace name and its schema. The ServiceMap data type provides the following tables:
- VMBoundPort
- VMConnection
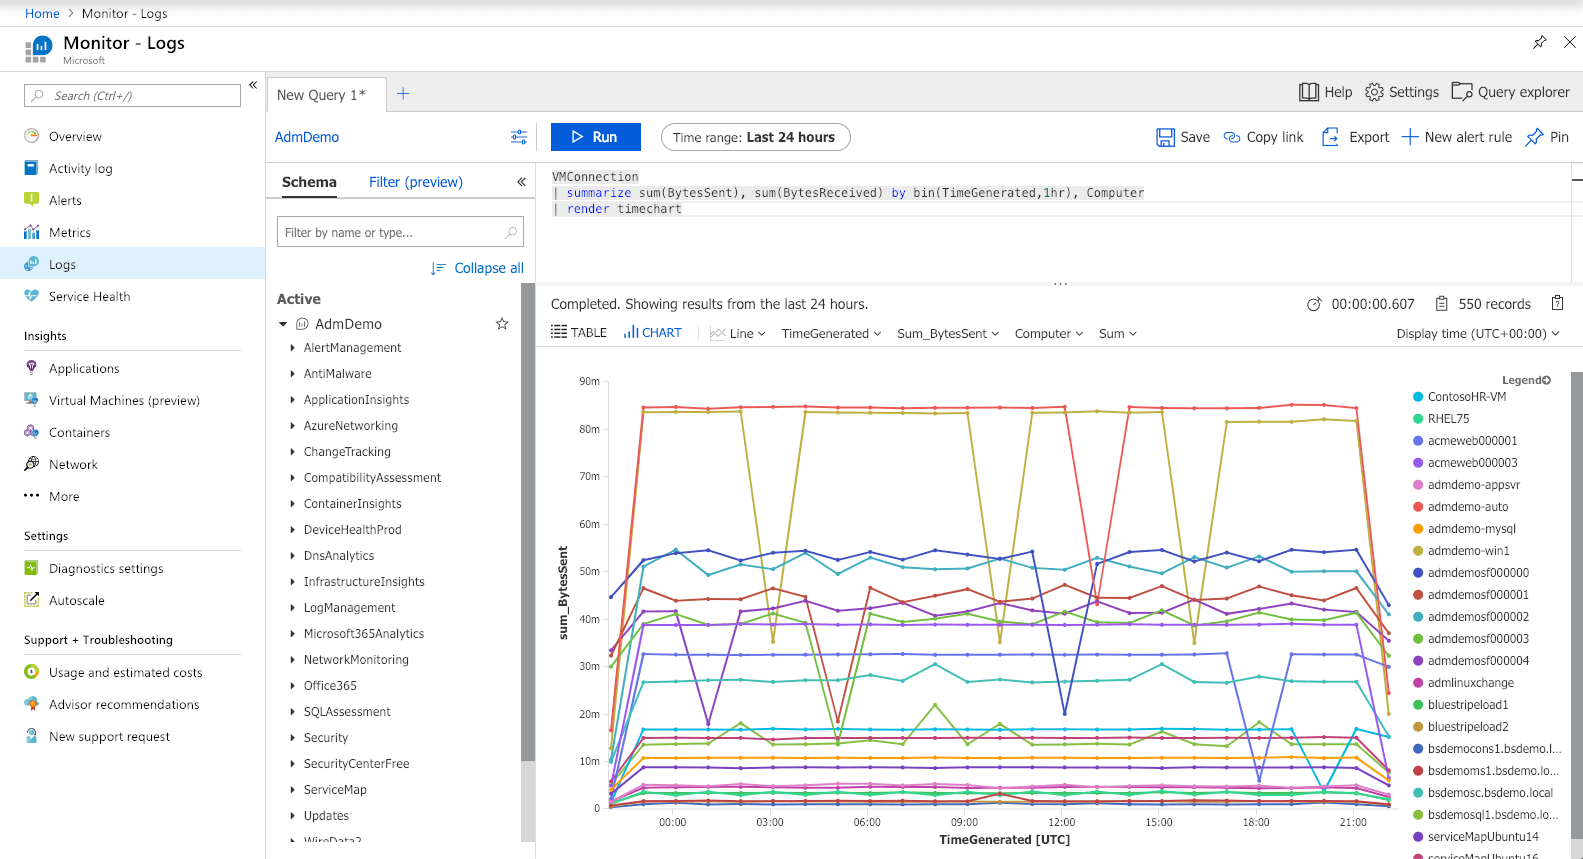
Run the below examples by pasting them into the Log Analytics query box. Edit the queries and provide the name of your computer where appropriate.
Common query samples
The count of ports open on your VMs:
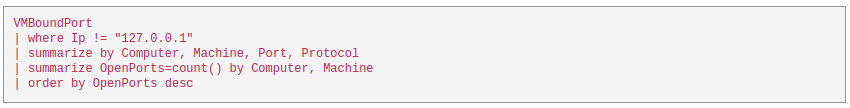
List the bound ports on your VMs:

Analyze network activity by port:

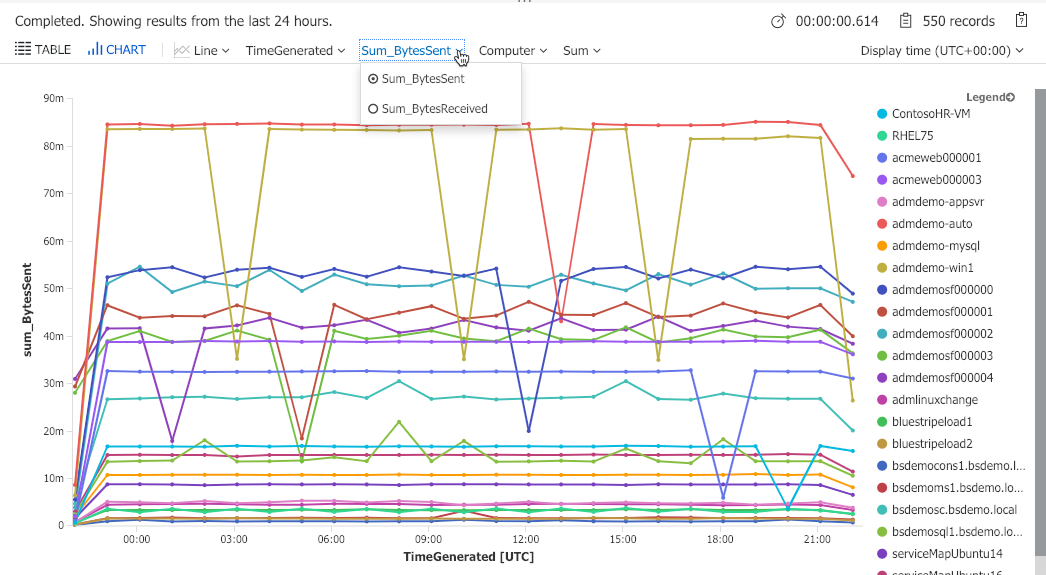
Bytes sent and received trends:
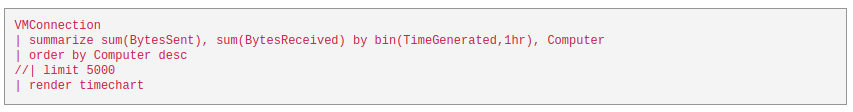
When having a lot of computers it is advisable to uncomment the limit statement in the example above. Use the chart tool to view either bytes sent or received and to filter out specific computers.
Connection failures over time:
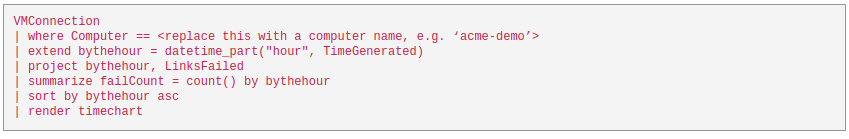
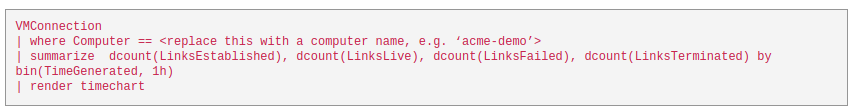
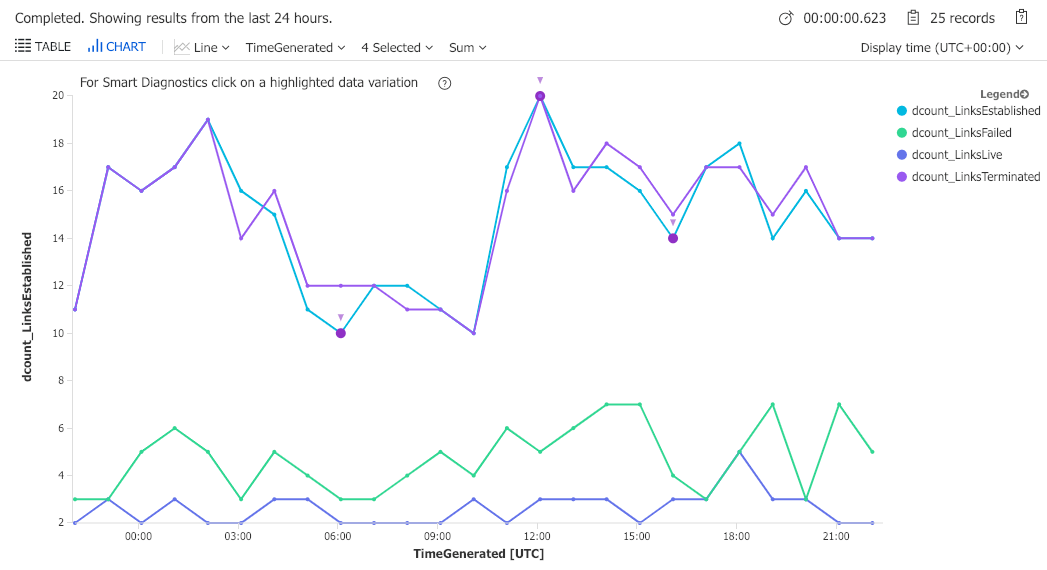
Link status trends:
Getting started
To learn more about Azure Monitor for VMs, check out the following links:
- on-boarding to Azure Monitor for VMs
- overview: “What is Azure Monitor for VMs (preview)”
- documentation for querying data with Log Analytics
Get the best out of your Azure resources with CloudMonix
While Azure Status Page and Azure Service Health provide basic monitoring and alerting of the status of your resources, users that require advanced monitoring, auto-scaling or self-healing features for their cloud instances, should learn more about CloudMonix. Along with advanced features designed to keep Azure resources stable, CloudMonix also provides powerful dashboards, historical reporting, various integrations to popular ITSM and other IT tools and much more. Check out this table for a detailed comparison of CloudMonix vs native Azure monitoring features.


Leave A Comment