
With the recent announcement of the general availability of MariaDB we would like to share some best practices for alerting on the most commonly monitored metrics for the database.
Monitoring databases is an essential part of maintaining server reliability, availability, and performance and Microsoft provides various metrics for MariaDB to get insights into the behavior of the server. Azure Portal, as well as Azure CLI, allow setting alerts on these metrics.
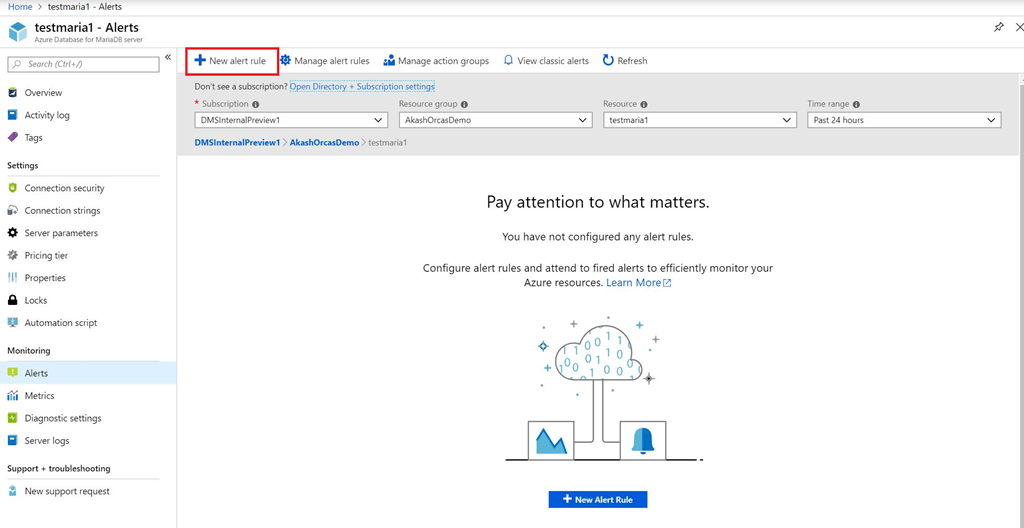
Below are some best practices on monitoring data on a MariaDB server along with improvement considerations based on these metrics.
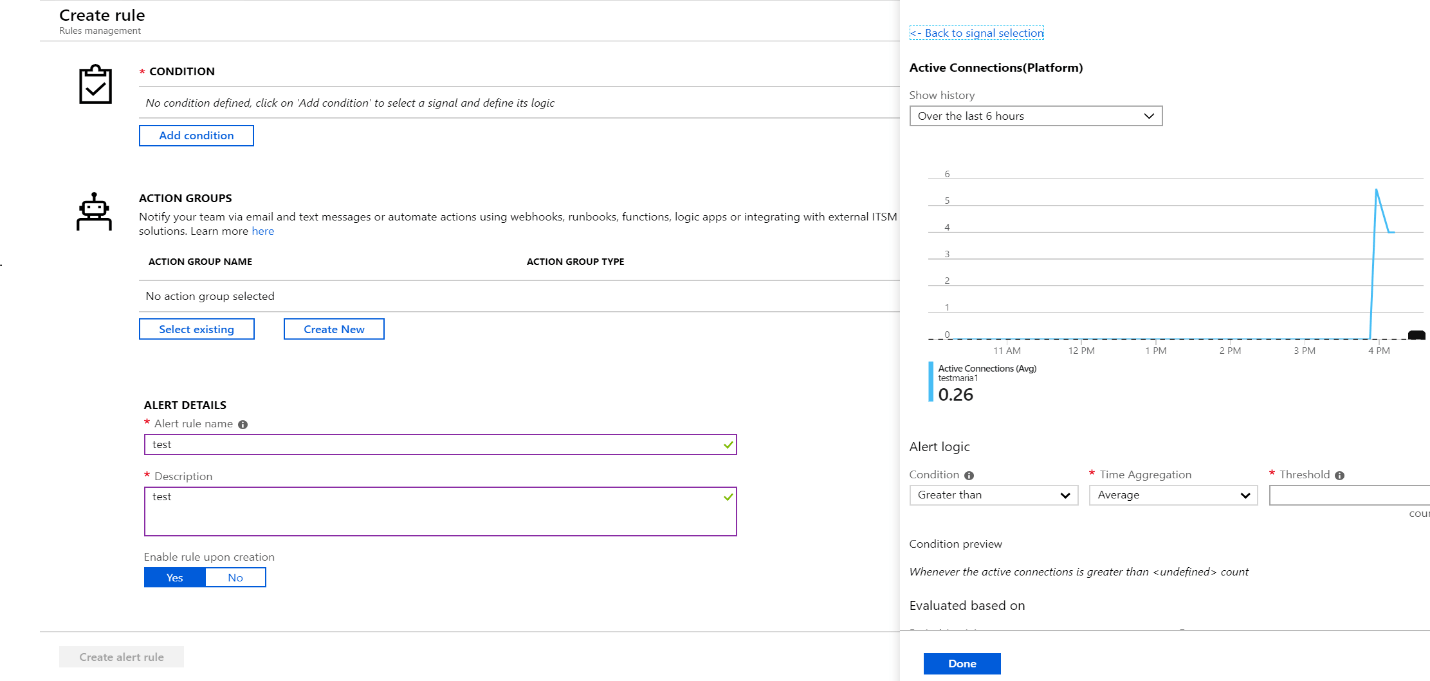
Active connections monitoring
Here we set a sample threshold of 80 percent of a total connection limit or greater than or equal to 30 minutes and check it every 5 minutes.
What to check:
If the active connections are at or above the total limit over the past half hour, verify this is expected behavior based on the workload. If the workload is expected active connections can be increased by upgrading the pricing tier or vCores. Read more about the active connections limits for each SKU in Limitations in Azure Database for MariaDB.
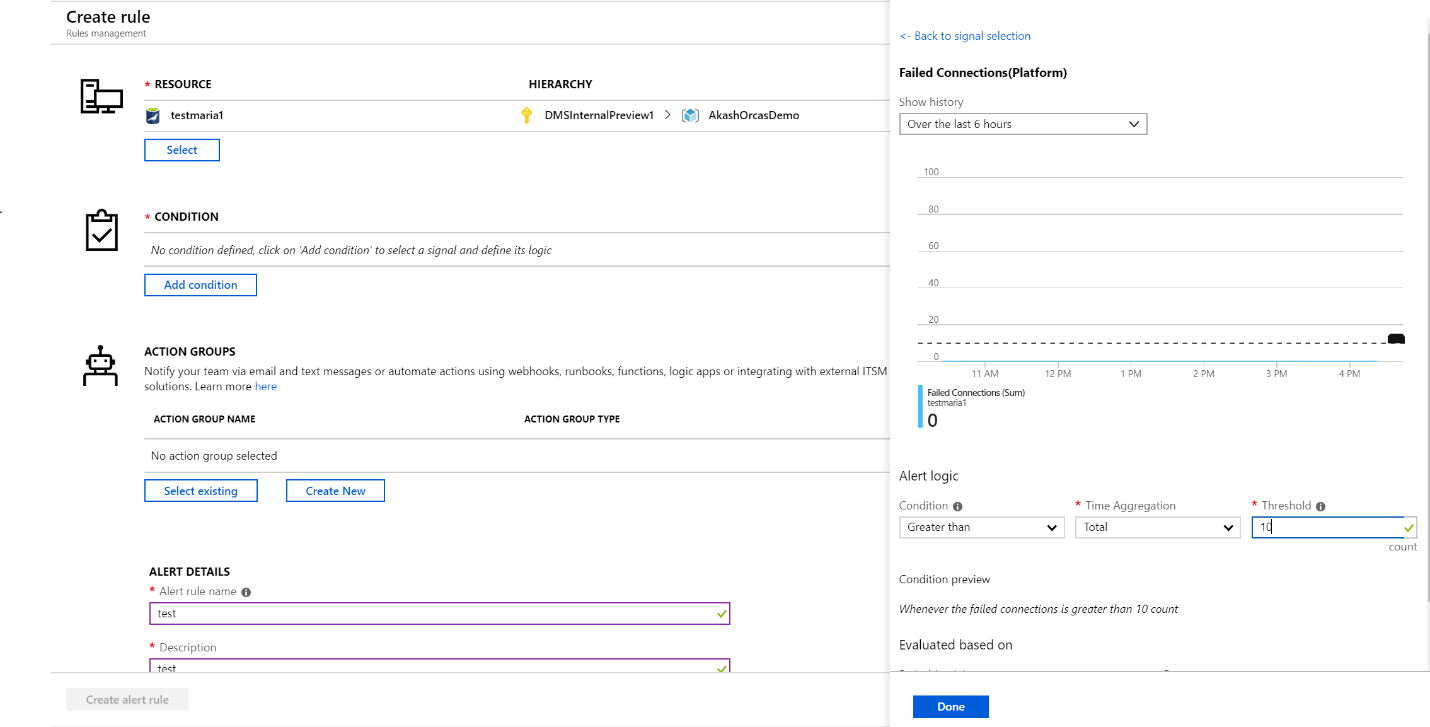
Failed connections monitoring
Sample threshold is set at 10 failed connections during the last 30 minutes checked every five minutes.
What to check:
If the connection request failures take place over the last 30 minutes check the logs for failure reasons.
CPU or memory percent monitoring
Sample threshold is 100 percent for five minutes or 95 percent for more than two hours.
What to check:
If the CPU or memory usage is at 100 percent check your logs to understand the nature and impact of the errors. Check the number of active connections. Consider scaling up compute if your application has exceeded the max connections or is reaching the limits.
IO percent
Sample threshold: 90 percent usage for equal to or greater than 60 minutes.
What to check:
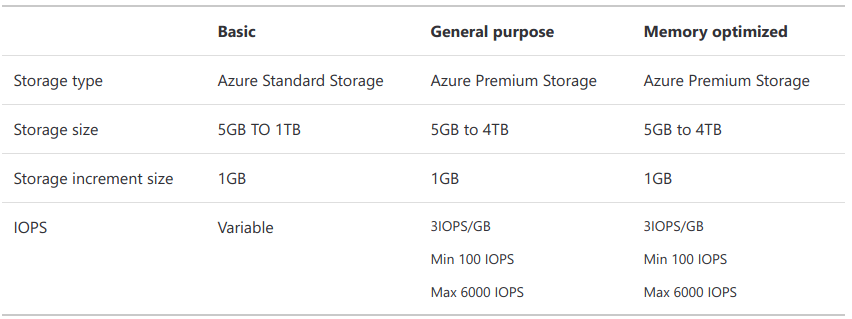
Verify the application workload if your IOPS is at 90 percent for one hour or more. If you see that IOPS is at 90 percent for one hour or more, verify if this is expected based on the application workload and increase your IOPS limit if necessary. Below is an illustration of storage to IOPS mapping for reference:
Storage:
The provisioned storage is the amount of storage capacity available to an Azure Database for MariaDB server. The storage is used for the database files, temporary files, transaction logs, and the MariaDB server logs. The total amount of the provisioned storage also defines the I/O capacity available to a server.
The storage you provision is the amount of storage capacity available to your Azure Database for PostgreSQL server. The storage is used for the database files, temporary files, transaction logs, and the PostgreSQL server logs. The total amount of storage you provision also defines the I/O capacity available to your server.
Storage percent monitoring
Sample threshold is 80 percent.
What to check:
It is important to monitor the usage of storage as if a server is reaching provisioned storage limits, it will soon be out of space and set to read-only. You can also provision for more storage to continue using the server.
Monitoring performance and automating your application running on Azure
Azure Portal provides basic monitoring for Azure applications. Users that require advanced monitoring, auto-scaling or self-healing features for their cloud and on-premises instances, should learn more about CloudMonix. Along with advanced features designed to keep Azure applications stable, CloudMonix also provides powerful dashboards, historical reporting, various integrations to popular ITSM and other IT tools and much more. Check out this table for a detailed comparison of CloudMonix vs native Azure monitoring features.


Leave A Comment