Azure Monitor is the built-in platform to access and check the native resource metrics and check the performance of their workloads in Azure. The new features are added up to Azure Monitor for metrics which let you visualize your metrics, unlock the deeper insights and monitor Azure resources. More metrics are used for more Azure resources and even you can get metrics via Azure Monitor too. You can get these metrics from Azure Portal or Azure Monitor REST APIs. Here are some new resources available for Azure Monitor:
- Automation and Autoscale
Automation feature is responsible for providing you the information about the jobs your Azure Automation accounts are running while the autoscale enables you to know how you Autoscale settings are being evaluated. Moreover, it lets you know about the metrics values are being read and the further actions are being taken.
- Classic Compute and CosmoDB
Classic compute allows you to access the host metrics including Network In/Out, CPU Percentage, and Disk Read/Write for your Classic Compute VMs. CosmoDB determines the request counts according to the region, code, collection, and status.
- DataLakes Analytics and DataLake Store
DataLakes Store gives a deep visibility into the data stored, written, and read in the DataLake Store Account and Datalakes Analysis informs you about the successful and canceled jobs in DataLake Store Account.
- Express Route and Public IP Addresses
Express Route counts the total bytes ingressing and egressing the Express Route Service and Public IP Addresses enable you to get to know about the inbound packets and bytes being forwarded.
- Software Load Balancer
Ask the available VIP and DIP endpoints for your load balancer and take measures according to it.
- Storage and Traffic Manager
With the help of storage account, you can access capacity and transaction of your storage metrics and avail the additional services like queues, tables, blobs, and files. Similarly, you can also check query metrics for your traffic manager and endpoints.
What is the Multidimensional Metrics?
Azure Monitor supports multidimensional metrics and provides the information about attributes, name-value pairs, and the segment of a metrics. See the metrics with the supported APIs.
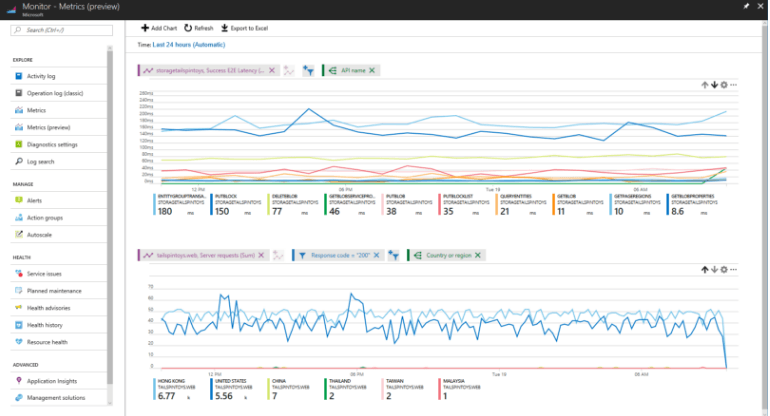
New Metrics Charting Experience
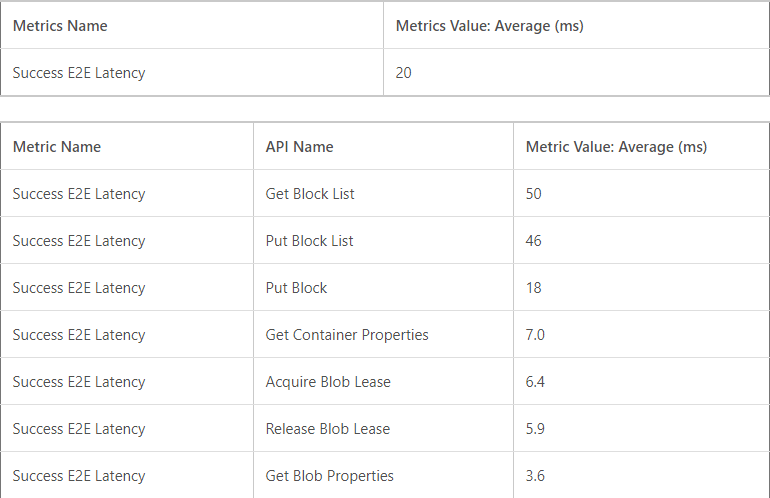
The brand-new metrics charting experience lets you know the resource type subscriptions, resource group. Moreover, it can be customized with the help of filters and segmentation. To share these charts with other members, you have to pin them with the dashboard. Here we will take the example of ‘Success E2E Latency’ which is used to explore the average latency of transaction used for Storage resource.
Metric definitions REST API, the metrics REST API, and .NET samples are the links to experience the new features of Azure Monitor.


Leave A Comment