SQL Monitoring tools help monitor, optimize and automate day to day database administration and management operations. They provide database administrators, designers and engineers with knowledge and power to optimize their database systems for optimal business performance in diverse, complex production environments.
Whether your needs are for on premises, cloud or hybrid database infrastructures, SQL Monitoring Tools can help help you improve your database operations.
Because SQL Monitoring is a vast domain and includes many areas of database monitoring and management, we have searched and compiled a list of SQL monitoring tools nearly in every niche and need. From automatic monitoring, performance management, instant alerts to configuration management , this list contains the best SQL Monitoring tools you need for on-premises Microsoft SQL Server instances to SQL Azure databases.
CloudMonix
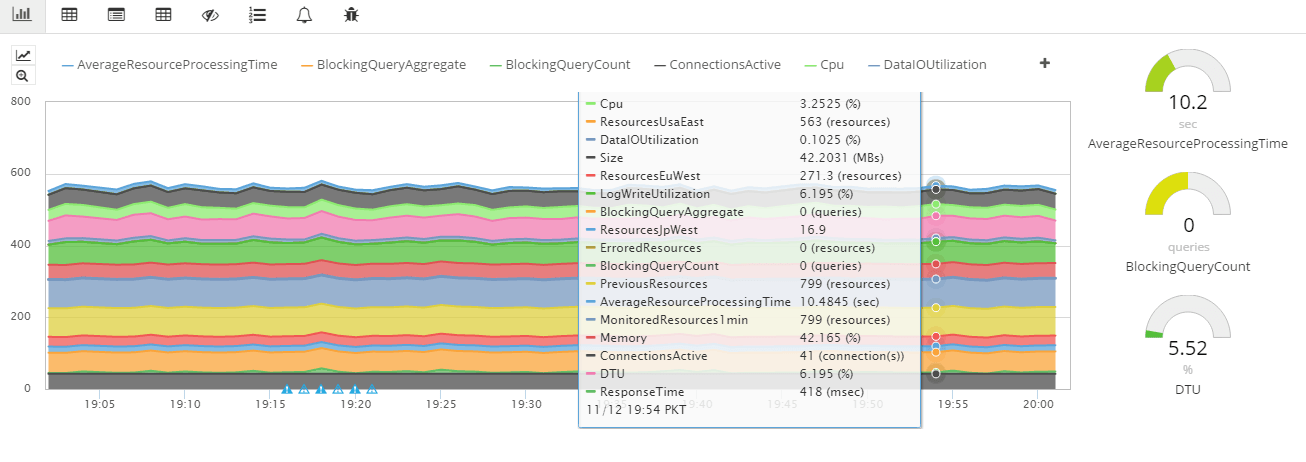
CloudMonix demystifies the utilization of SQL Azure performance tiers, database throughput units (DTUs), visualizes important metrics and tracks slowest areas. CloudMonix can monitor and automate SQL Azure by querying Dynamic Management Views, visualizing important performance metrics, exposing slowest queries, executing custom SQL scripts, and more.
With CloudMonix’s SQL Azure Database Monitoring Support, database administrators can:
- Track CPU, Read/Write utilizations and other key performance indicators
- Visualize top queries and active connections
- Know when database resources reach maximum capacity
- Get alerted for outages, blocking queries and system slowdowns
- Define and track custom SQL metrics and trigger execution of custom SQL queries.
With CloudMonix’s Windows Virtual Machine Monitoring Support, database adminhistrators can:
- Track Windows Server vitals, such as CPU, Memory, Disk, and Network performance metrics
- Track any SQL-Server specific metrics such as SQL blocked processes, batch requests, buffer ration and compilations
- Get alerted for outages, lock waits, low buffer hit ratios, low page life expectancy, high compilations and more
- Automatically run PowerShell commands as reactions to production conditions
Manage Engine
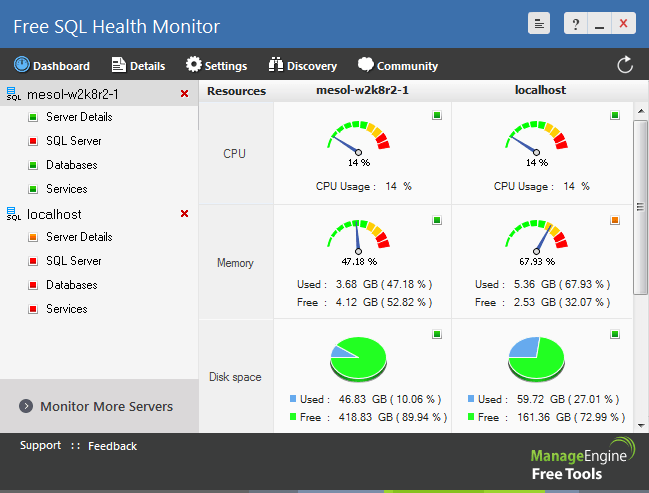
Manage Engine SQL Health Monitoring Tool helps monitor MS SQL Servers for performance and availability. The tool supports both default and named instances and can monitor all the MS SQL versions including MS SQL 2012 and 2014.
Spiceworks – SQL Monitoring Software
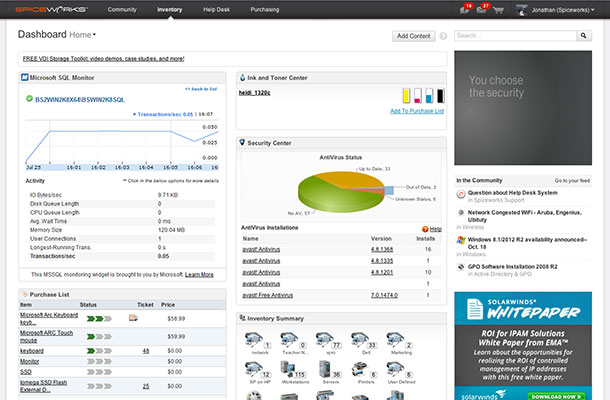
Spiceworks SQL Server Monitoring, you can monitor SQL Server size, connection, speed & more. Spiceworks automatically retrieves information about SQL databases on your network (SQL Server 2005 and higher). Health checks are run every minute to ensure info is always accurate and up-to-date.
Solar Winds
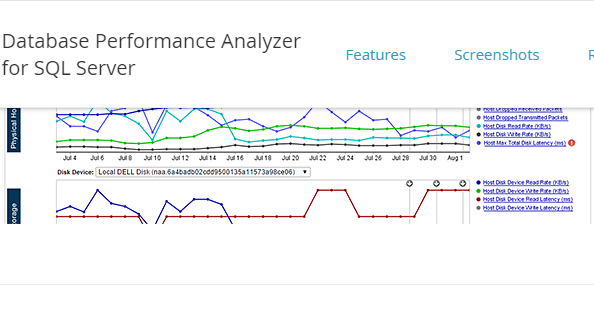
Database Performance Analyzer for SQL Server by Solar Winds provides a faster way to identify and resolve SQL Server performance problems. Solar Winds Database Performance Analyzer uses response time analysis to get to SQL Server performance problems quickly for on premises or in the cloud SQL Server instances. DPA also helps identify the core performance issues impacting SQL Server running in Windows® Azure.
DBArtisan
DBArtisan is a database administration solution that uses integrated performance analytics and team sharing capabilities to maximize availability, performance, security and collaboration across multiple SQL Server DBMSs. DBArtisan helps in lowering costs and save time by leveraging SQL Server performance insights to identify issues and provide resolutions.
Redgate – SQL Monitor
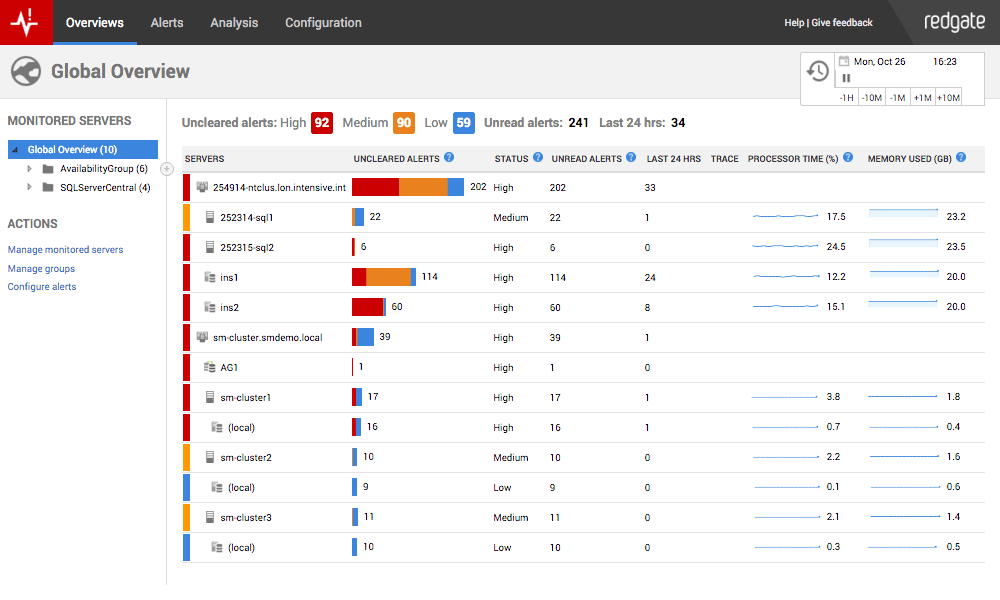
SQL Monitor monitors SQL Servers 24/7 and gathers the metrics that will allow DBAs to diagnose CPU, memory or I/O issues on their SQL Servers. It provides a set of accurate, reliable, configurable alerts that will inform the DBA of any abnormal or undesirable conditions and properties, as well as specific errors, on any of the monitored servers.
SQL Sentry (Multiple Products)
SQL Sentry has several SQL Monitoring products;
SQL Sentry Performance Advisor monitors relevant metrics and provides insight into poorly performing SQL, blocks, deadlocks, storage and I/O bottlenecks, as well as system resource usage.
SQL Sentry Event Manager provides DBAs with “Outlook-style” visibility and functionality for managing SQL Agent jobs, Windows Tasks, and Oracle jobs in increasingly complex cross platform environments.
SQL Sentry Plan Explorer builds upon the graphical plan view in SQL Server Management Studio (SSMS) to make query plan optimization more efficient. It is a lightweight standalone app that does not require a collector service or database.
SQL Sentry Performance Advisor monitors relevant metrics and provides unmatched insight into poorly performing SQL, blocks, deadlocks, storage and I/O bottlenecks, as well as system resource usage.
Idera
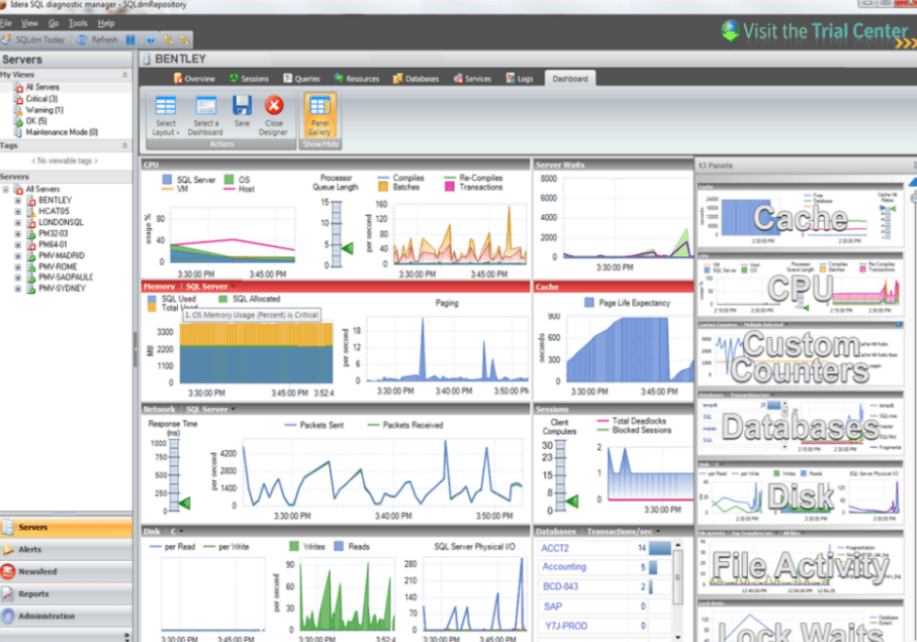
Idera’s SQL Monitoring Tool provides performance monitoring for physical and virtual environments, query plan monitoring to see causes of blocks and deadlocks and predictive alerting with settings to avoid false alerts in a web-based dashboard. It also helps in understanding trends and view forecasts of your SQL Server environment to better plan for future needs and provide an overview of SQL Server sprawl with database growth reporting.
Heroix Longitude
Heroix Longitude database performance monitoring software provides agentless SQL Server monitoring by proactively monitoring key performance metrics to ensure database is running optimally and alerts when there is a problem. Longitude also provides pre-configured, on-demand reports and graphs of key performance metrics to help proactively take action and ensure maximum availability.
Lepide SQL Storage Manager
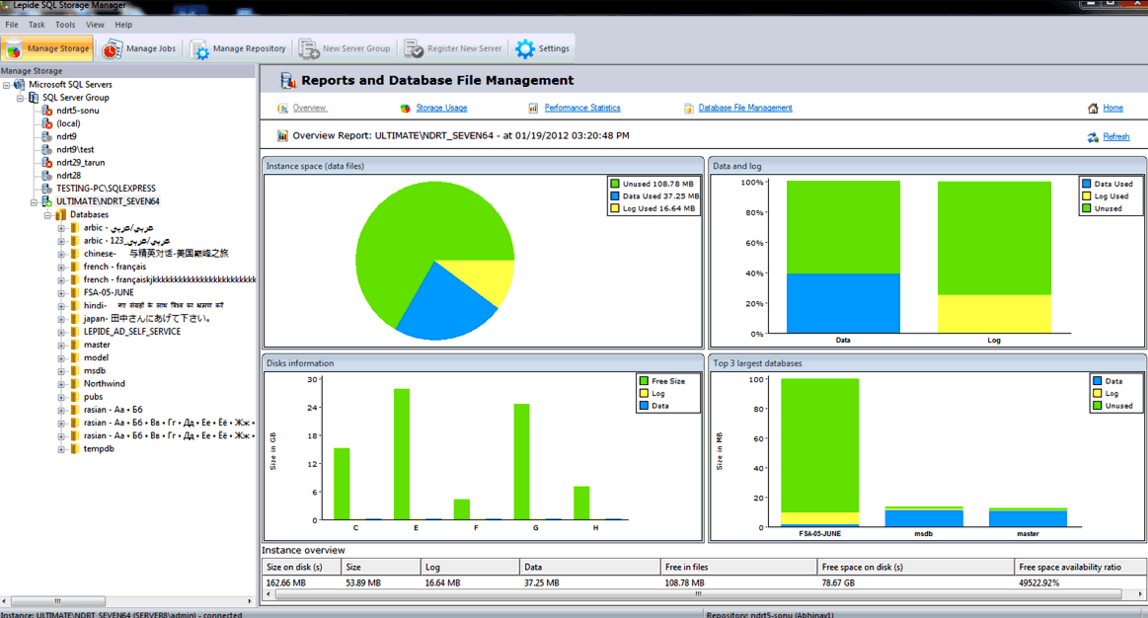
Lepide SQL Storage Manager is a SQL solution to analyze performance and storage structure of SQL server. It enables data administrator to observe storage space and performance of all or individual instances and forecast future requirements. It alerts the administrator for capacity, performance and storage space issues and requirements to effectively manage space and make the most of server performance and storage capacity.
SQLCentric
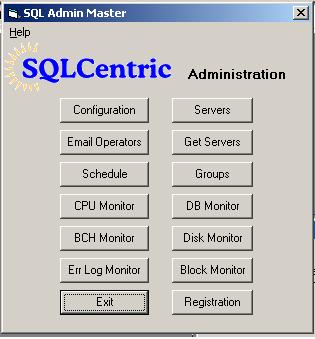
SQLCentric, is a Web-based MSSQL-Centric Network Database Monitoring & Alert System, for SQL Server infrastructure. The SQL Centric tool can monitor all logical disk partitions on a server, CPU processor utilization and SQL Server Logs for any error and warnings. It can identify issues that can cause poor performance by monitoring blocked processes, long running queries with failure alerts. .
SQL Power Tools
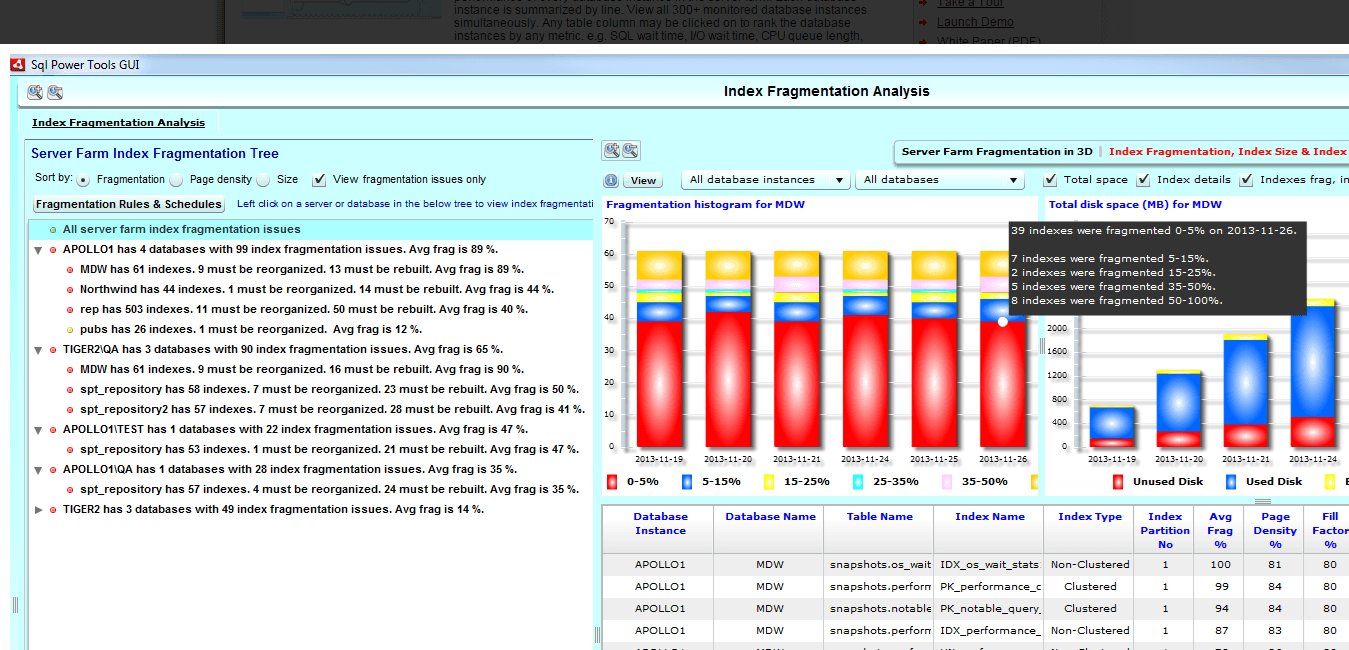
SQL Power Tools provides agentless monitoring of wait types, SQL wait times, I/O wait times, blocking, deadlocks, disk bottlenecks, TempDb bottlenecks, SQL performance, SQL plan mining, Top N SQL, performance counters, disk mirroring, availability groups, procedure cache, buffer cache, database space, disk drive space, low free disk space, high disk space growth, index fragmentation, SQL Agent jobs, performance baselines and VMware.
ApexSQL Monitor
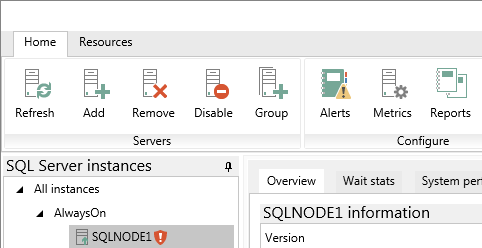
ApexSQL SQL Monitoring Tool enables in monitoring multiple SQL Server instances, view system performance metrics and identify performance issues and deadlocks. It has an intuitive dashboard that enables in viewing metrics, analyzing queries, calculate thresholds and visualize performance data.
Nagios
Nagios provides complete monitoring of SQL Server including availability, database and table sizes, cache ratios, and other key metrics. It enables in increased database performance, quick detection of database outages & failures and predictive analysis of storage requirements and index performance.
SQL Solutions (Multiple Products)
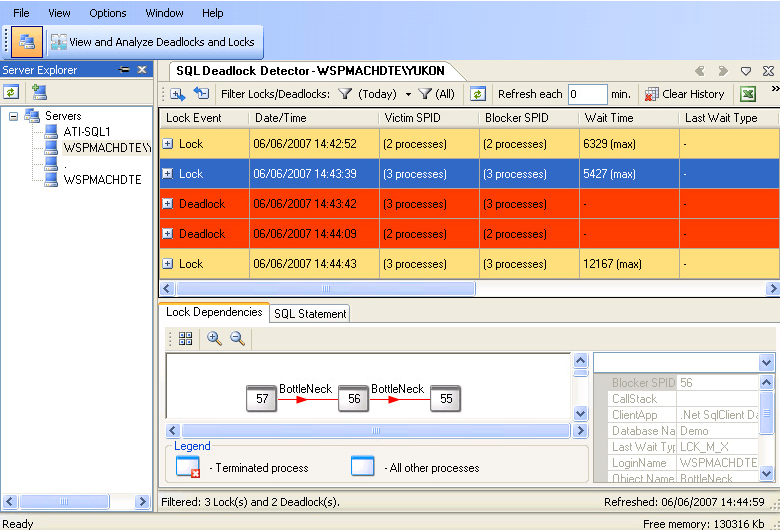
SQL Solutions has multiple products to monitor performance of SQL Server;
SQL Deadlocks – Monitor and detect blocking SQL code, locked objects and deadlock victims
SQL Heartbeat – Tool for Monitoring SQL Server Performance such as physical server activities, server reads/writes and buffer cache hits.
SQL Trace Analyzer – Analyzes SQL trace to locate bottlenecks.
SQL Ultimate Debugger- It debugs stored procedures on SQL Server.
SQL Server FineBuild
SQL FineBuild makes it easy for anyone to produce a clean and recommended installation and configuration of SQL Server. It provides installation mode for both pro and amateur DBA. Such as for experienced DBA, FineBuild will simplify the automated deployment of a site. For inexperienced DBA, it packages the essential components and configurations to install SQL Server with Service Packs, updates, and useful tools – all configured for best performance.
SQL Server Performance Monitoring by AppDynamics
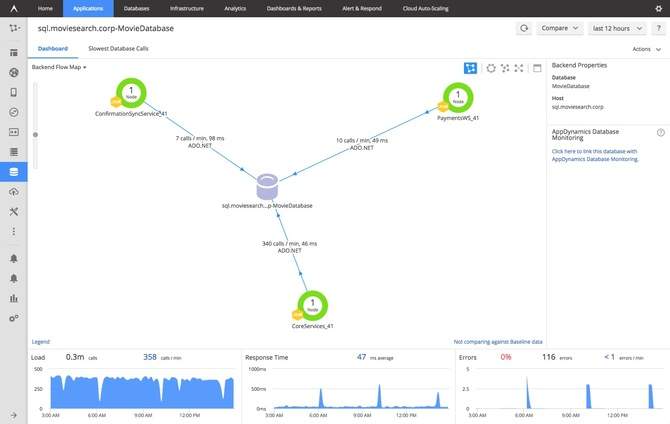
The AppDynamics Database Monitoring product module for Microsoft SQL Server is a comprehensive tool used to monitor all versions of SQL Server instances running on any platform. It provides visibility into SQL Server performance, resource consumption and troubleshoot issues with one-click SQL statement analysis and a holistic view of SQL Server objects.
SSIS Package from Melissa Data
Data Quality Components for SSIS is a suite of custom data cleansing transformation components for Microsoft SQL Server Integration Services (SSIS). It provides client tools to standardize, verify, correct, consolidate, and update all contact data in a SQL Server database.
Paessler – PRTG SQL Monitoring
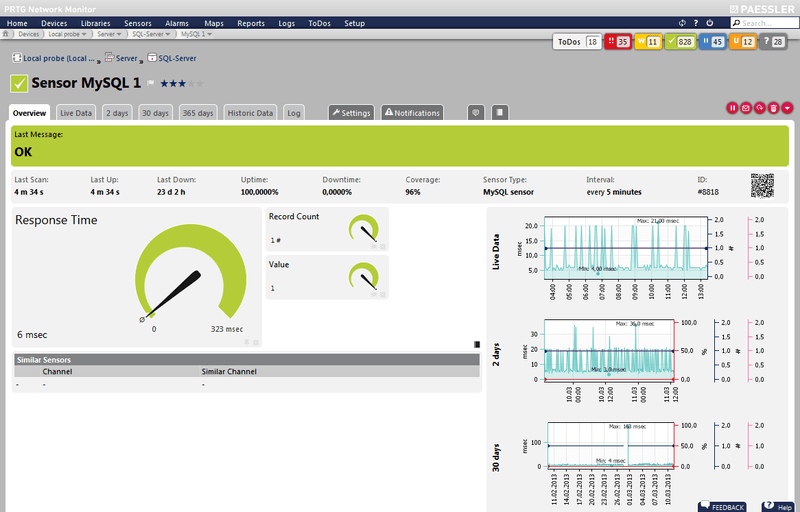
PRTG delivers SQL server monitoring and automated alerts for the most common types of SQL servers. It ensures the availability of network components and databases while also measuring traffic and usage. It helps in avoiding outages, ensuring database performance, optimizing connections, saving time and controlling service level agreements (SLAs).
Site 24×7
Site 24×7 SQL Server Monitoring Tool monitors status, cache hits, errors, replications, SQL compilations, longest transaction time of SQL instances and capture database attributes like data file size used, log file size, log cache hit ratio and more.
SQL Server Auditing with Netwrix Auditor
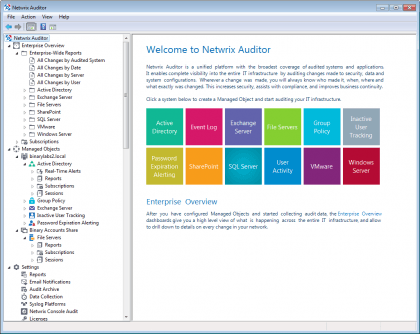
Netwrix Auditor for SQL Server is a SQL server auditing solution that detects and reports all SQL server changes. It provides visibility into changes made to SQL instance configurations that impact availability and confidentiality of databases. By default the solution stores auditing intelligence for 7 years for forensic analysis and periodic checks by both external and internal auditors.
SQL CheckUp
SQL Checkup provides monitors SQL Server instances for current activities, blocks, disks/dbs/instances performance counters, waits, space usage, query performance and more. Administrators can view current and past state metrics, allows in setting alerts on thresholds and baselines and overall queries/ procedures performance on each monitored instance.
dbmonitor
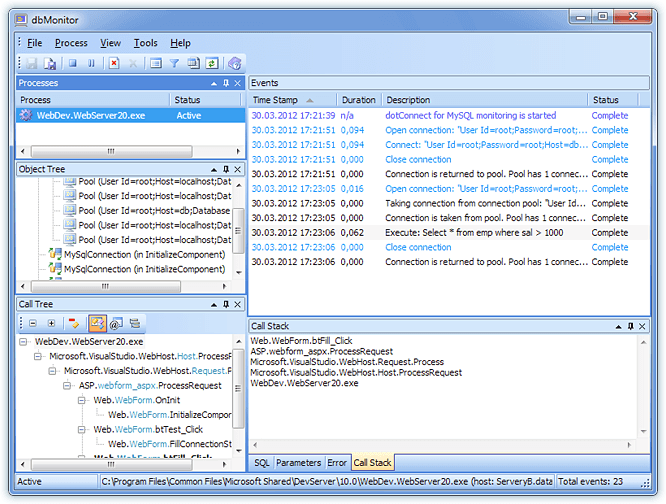
dbMonitor performs per-component monitoring and tracing of database events such as commit, rollback, SQL statement execute, creating and destroying components, connection pooling events etc. It enables in tracing SQL parameters, client processes and sorting and filtering events using different conditions.
Cotgea
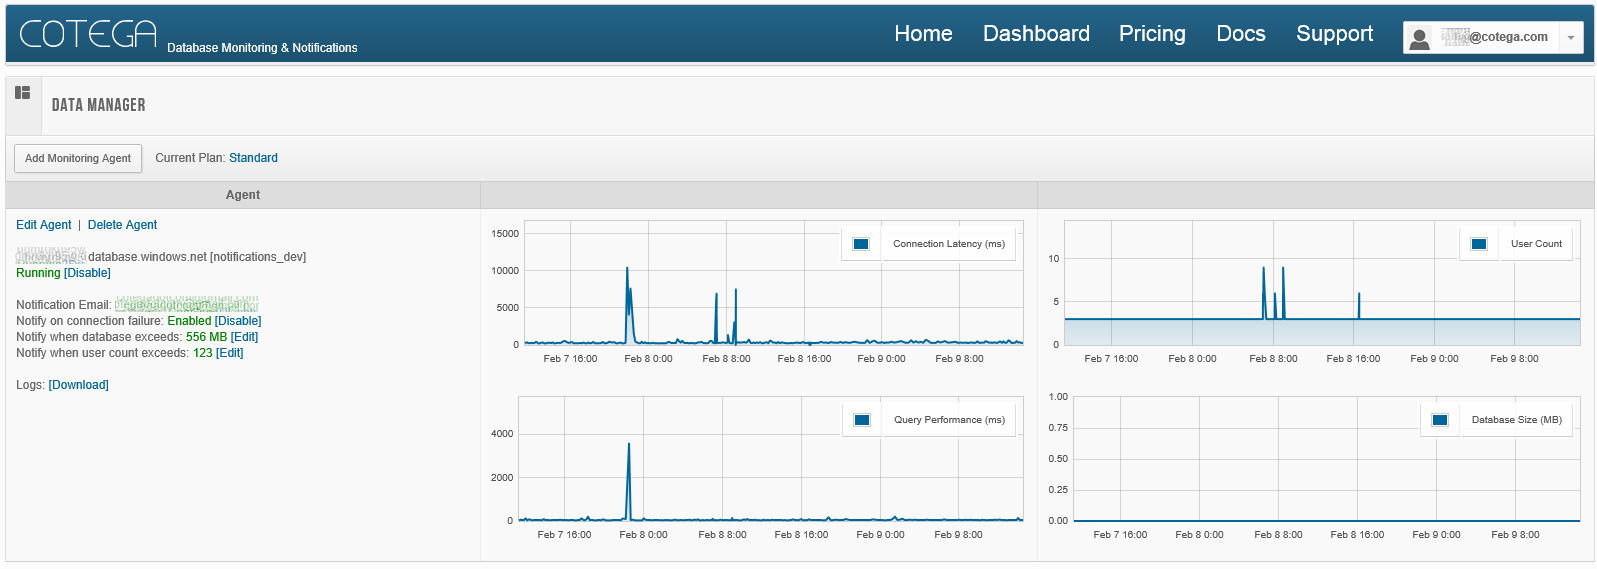
Cotega is a service for monitoring SQL Azure and SQL Server databases. Cotega notifies of database issues as they happen via sms / email, monitor database performance, data synching between local and SQL Azure and enables in viewing historical performance.
Dell Spotlight
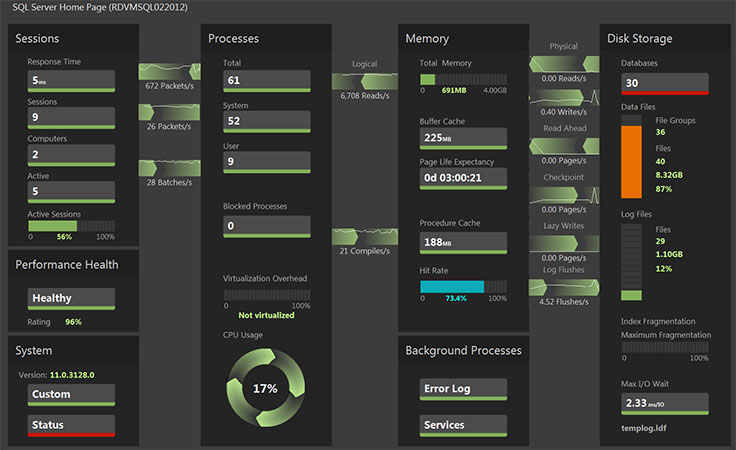
Dell Spotlight on SQL Server Enterprise provides simple monitoring, diagnosis and optimization of SQL Server environments to ensure peak performance. It constantly provides intuitive overview of enterprise SQL health and performance, automated alerts and actions, integrated tuning module, mobile device support and more.
Monitis
Monitis application monitor for SQL enables you to track the performance of your SQL environments. It provides a central interface to diagnose, monitor and optimize the processes inside SQL based applications and services.
MiniDBA
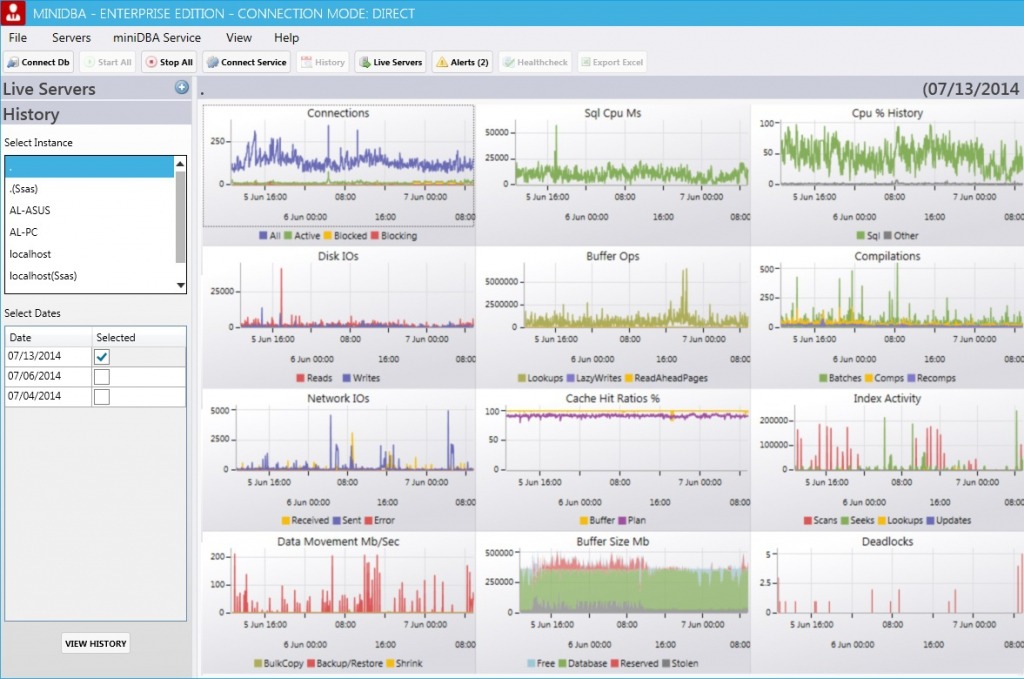
MiniDBA SQL Monitoring tool provides realtime view of server performance and ways of optimizing operations. SQL Administrators can monitor databases, connections, latencies, alerts on deadlock / blocking queries and a number of health checks to keep the overall system performing optimally.
Have we missed any SQL Monitoring Tool? If yes, than please let us know in your comments.


I think your missing Monitis in the list.
Monitis provide SDKs for most popular languages – Java, Perl, Python, PHP, Ruby, C# — popular web and application servers such as Apache, Nginx, IIS, Tomcat and Node.js, various database servers such as MySQL, Postgres, MongoDB and SQL Server, and more. You’ll find a comprehensive list here: http://goo.gl/apoY5G
Thanks for informing Lilit. I have added Monitis to the list now.
Hi – I think you’ve missed miniDBA. It does a desktop and mobile product – I use the live waits view all the time.
http://www.minidba.com
Just added MiniDBA to the list.
You have also missed Dell Spotlight for SQL Server off your list.
I have added it now Scott. Thanks for pointing that out.
You missed probably one of the biggest players in the SQL Server monitoring field – Spotlight by Dell (http://software.dell.com/products/spotlight-on-sql-server-enterprise/)
Yes Martin. But its now part of the list 🙂
I don’t see Dell Spotlight for SQL Server Enterprise. Latest version includes detailed Tempdb metrics, workload analysis and comprehensive health monitoring.
Yeah, it wasn’t there initially. But I have added it now Jim.
I’m quite shocked you don’t have Dell (Quest) Spotlight on the list. Been using it for the past eight years or so and it’s a very solid SQL Server DBA monitoring tool.
It got missed somehow Allen, but now I have added it in the list too 🙂
What about OPServer?
How do you usually use these monitoring tools?
Do you establish a list of parameters / metrics that should be monitored, and to what threshold should each generate an alert for SQL servers and databases?
Are you alerted only to incidents that you should be taking action on, i.e. only actionable alerts?
Any ideas on how to come up with list of metrics and thresholds for alerts?
Do you rely completely on such alerts automation or do you check manually some areas?
You missed System Centre Operations Manager (SCOM). The SQL MP is one of the best.
You’ve missed SCOM. The SQL MP is really good
Precise I3.
Can you add SCOM please?
dbWatch should be on your list – see http://www.dbwatch.com. Scales exceptionally well and easy to use.
Can we use icinga2 to monitor Microsoft SQL Server?
Hello,
I think you should check out SQLTreeo Monitoring , this is a new product with functionalities on par with redgate/manageengine.
I’ve been using it for quite some time now and it works great , some bugs encountered but they are fixed very fast.
It even has a replication module and high availability, installation is easy to , but took me some time to figure out. just needed to download an ” Agent” inside domain that monitors my ms sql; servers. Servicedesk is helpfull to. they show information that i manually need to check on daily base.
This is an interesting blog and so much info it occupies about SQL server monitoring. And i read from it that it continuously do database monitoring and analyzing by which it catch out the malicious attacks which occur suddenly.
Check also netdata ( https://my-netdata.io )
It can monitor mySQL, mariadb, postgres, redis, memcached, mongodb among dozens more applications.
It supports alerts too.